
練習問題 6
matplot 練習問題 6
Python ソースコード: plot_exercice_6.py
import numpy as np
import matplotlib.pyplot as plt
plt.figure(figsize=(8, 5), dpi=80)
plt.subplot(111)
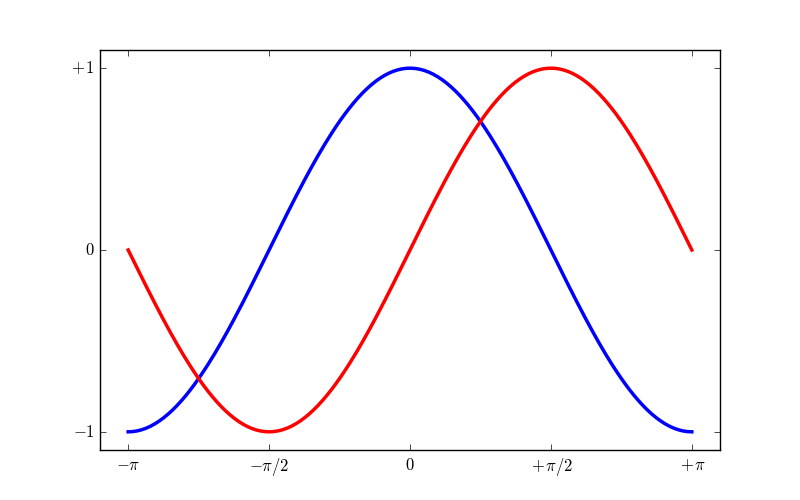
X = np.linspace(-np.pi, np.pi, 256, endpoint=True)
C = np.cos(X)
S = np.sin(X)
plt.plot(X, C, color="blue", linewidth=2.5, linestyle="-")
plt.plot(X, S, color="red", linewidth=2.5, linestyle="-")
plt.xlim(X.min() * 1.1, X.max() * 1.1)
plt.xticks([-np.pi, -np.pi/2, 0, np.pi/2, np.pi],
[r'$-\pi$', r'$-\pi/2$', r'$0$', r'$+\pi/2$', r'$+\pi$'])
plt.ylim(C.min() * 1.1, C.max() * 1.1)
plt.yticks([-1, 0, +1],
[r'$-1$', r'$0$', r'$+1$'])
plt.show()
Total running time of the example: 0.08 seconds ( 0 minutes 0.08 seconds)